Time is Money
In a previous blog I put the proposition (which everyone should agree with) that one of the major limitations on controlling paper quality on the paper machine was the inability to measure confidently and at a high enough rate to allow decisions to be made on whether a machine adjustment is called for (and having measured appropriately have access to process levers that act quickly enough). I expect there is not much argument with that. I also put the view that failure to do this costs a typical paper machine between $10 and 20 million dollars per year. I would expect there will be a lot of questions about that. If there wasn’t why doesn’t everyone attempt to do it? It would be worth millions.
Many measurements over the last few decades have shown that the variation in property (like tensile, SCT or ring crush) on a commercial paper machine, whether it is in Sweden, Australia, Europe or the USA, is of the order of 20-25% of its average property. The most recent work shows that variation with a particular grade run is around 10-15% and from one run to the next for the same grade this variation increases to 20-25%.
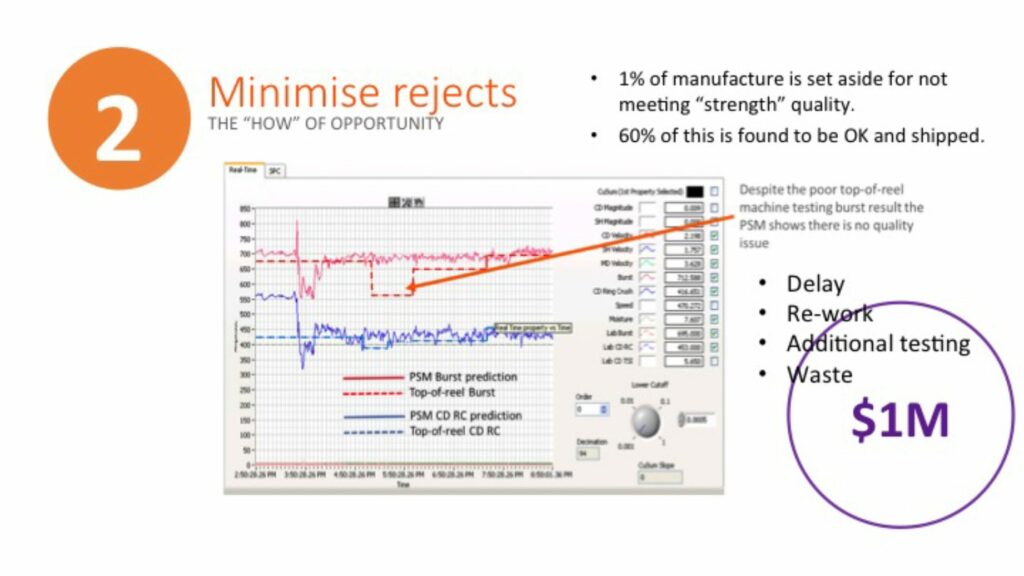
So what does this all mean in terms of money? The purpose of paper quality is to ensure that paper that is manufactured is “fit for purpose”. That is, it meets the requirement and expectation of the customer. In practical terms we can more accurately say, that the paper at least meets the requirement of the customer. No matter to what criteria paper is manufactured (for example a grade property aim) it is sold on an expected minimum. If there is variation in property, the manufacturer must ensure that all (or in practice, most) of that variation exists above the expected minimum performance. If the extent of variation can be minimised (the distributions as shown in Figure 2 narrowed) then the average of the variation (the “aim”) can be lowered. There lies the potential for savings!
The benefit from this “narrowing” or minimisation of variation can achieved in one way: move the aim properties of the paper down while still meeting the minimum requirement. How to do this? Well, there are two main ways to achieve a lower aim, either: lower the basis weight or use less expensive materials (say replace virgin fibre with recycled fibre, increase filler content or lower starch addition) to make the paper.
Of these, the best return is obtained by lowering the basis weight. In a controlled environment this would mean letting the basis weight “float” over some range. Another way of looking at this is that the paper would no longer be sold by weight but sold by area. Of course for both approaches it is important to consider ALL the properties that would be affected. In any case, up to 10% down weighting might be a possibility while still meeting the minimum performance requirement. You can do the maths on potential savings.
As an example of the sort of things you can include in your calculations:
- Transport from the mill (per square meter)
- Paper machine production rate (square meters/hr)
- Refining energy
- Material cost per square meter of production
- Energy cost
As you can see the concept is remarkably straight forward, with high and nearly immediate returns. All we need is an on-line property measurement device, like AIP’s PQM-3, and some knowledge of how to change and control properties on the paper machine in real time. Simple!